Understanding Scope 2 Emissions: Sources, Calculation Methods, and Industry Applications

In today's data-driven sustainability landscape, one metric stands out as a critical indicator of corporate environmental impact: Scope 2 emissions. As companies worldwide race to achieve ambitious net-zero targets, understanding and managing these indirect energy emissions has become more crucial than ever. Did you know that for many organizations, Scope 2 emissions can account for up to 40% of their total carbon footprint? These indirect emissions from purchased electricity, heating, and cooling represent both a critical challenge and an unprecedented opportunity for businesses to demonstrate real climate action.
In this comprehensive guide, we'll break down the four main sources of Scope 2 emissions, explore proven calculation methods, and share practical insights through real-world case studies. Drawing from our experience working with leading sustainability practitioners and collecting ESG data across all industries, we'll show you exactly how Scope 2 emissions data can be turned actionable sustainability strategies. By the end of this article, you'll have the knowledge and tools to effectively measure, manage, and reduce your organization's indirect energy emissions.
The Four Sources of Scope 2 Emissions
Scope 2 emissions stem from energy sources critical to business operations, including electricity, heating, steam, and cooling. Each source has unique characteristics and applications, impacting sustainability goals across various industries. Let’s explore these sources and their specific roles in corporate sustainability.
Electricity: Managing Emissions in Energy-Intensive Sectors
Electricity is a major contributor to Scope 2 emissions, particularly in sectors with high energy demands. Reducing electricity-related emissions often involves managing energy consumption and exploring renewable options.

In the automotive sector, electricity powers production lines, robotics, and quality control systems. Tracking Scope 2 emissions helps auto manufacturers optimize energy use, source renewable electricity, and reduce their carbon footprint. For example, Tesla’s Fremont factory demonstrates the importance of electricity-related emissions data. The facility consumes substantial electricity for assembly lines and robotic systems. By installing solar panels and purchasing renewable energy certificates, Tesla has successfully reduced its Scope 2 footprint.
Heating: Sustainable Approaches for High-Use Industries
Heating is critical for companies operating in colder climates and sectors requiring climate control, such as hospitality and manufacturing. Managing heating-related emissions can significantly impact an organization’s sustainability profile.

Hotels and resorts rely on heating for guest comfort, from room heating to hot water systems. By analyzing Scope 2 data, hospitality companies like Marriott International assess their heating emissions separately from electricity, enabling them to target reduction efforts effectively. For instance, Marriott’s European hotels leverage district heating systems in cities like Copenhagen and Stockholm, supported by heat recovery technologies and building management systems.
Steam: Emissions from Industrial Processes
Steam, widely used in sectors like chemicals and petrochemicals, is an energy-intensive process that adds to Scope 2 emissions when sourced from conventional fuel grids. By monitoring steam-related emissions, companies can pinpoint high-energy processes and explore greener alternatives.

In chemical manufacturing, steam is essential for processes such as distillation and refining. For companies like BASF, Scope 2 emissions data on steam consumption reveals high-energy processes where sustainability improvements are possible. BASF monitors steam-related emissions via energy metering systems, which supports their transition to greener steam sources, including biomass boilers and waste heat recovery systems.
Cooling: Efficiency for Data-Intensive Operations
Cooling systems are essential in data-heavy industries like technology, where effective temperature control prevents equipment overheating. However, cooling often requires large energy inputs, making it a major target for efficiency improvements.

Data centers, such as those operated by Google, rely on cooling to prevent overheating. Tracking cooling emissions allows technology companies to implement advanced cooling techniques like liquid immersion cooling and renewable-powered chillers. Google’s data centers in Finland, for example, utilize seawater for cooling, reducing the company’s Scope 2 carbon footprint.
Methods for Calculating Scope 2 Emissions
To quantify Scope 2 emissions accurately, the GHG Protocol offers two calculation methods: the location-based and market-based approaches. Each method provides insights into emissions from grid energy sources and specific procurement choices.
Location-Based Method
The location-based method calculates emissions based on regional grid-average emission factors, offering insight into the carbon intensity of energy used in specific locations. This method helps companies understand how regional energy sources affect their Scope 2 emissions profile.

Example: A company in France, where energy largely comes from nuclear and renewables, will report lower location-based emissions than a similar company in Poland, where coal predominates. This method allows companies to assess how much their emissions depend on local energy infrastructure.
Market-Based Method
The market-based method, by contrast, accounts for a company’s actual energy procurement choices, like Renewable Energy Certificates (RECs) or Power Purchase Agreements (PPAs), to show direct actions taken to reduce carbon emissions. This method reflects the impact of renewable energy investments on a company’s Scope 2 profile.

Example: A U.S.-based manufacturer offsets its electricity consumption by purchasing RECs from wind farms. This lowers its market-based emissions, indicating the positive impact of renewable energy purchases compared to relying solely on regional grid electricity.
Case Study: Mr. Phillip’s Bike Factory
To illustrate Scope 2 data’s practical applications, consider Mr. Phillip, the owner of a mid-sized bike factory. By analyzing each Scope 2 source, Mr. Phillip identifies opportunities to reduce his factory’s emissions footprint.
- Electricity: Essential for powering factory machinery, lighting, and computer systems.
- Heating: Used in colder months to maintain optimal working conditions and equipment operation.
- Steam: Required for specialized welding processes in bike production.
- Cooling: Necessary during warmer months to keep facilities and equipment at safe temperatures.
To quantify his factory’s Scope 2 emissions, Mr. Phillip applies both the location-based and market-based methods. Using location-based factors for his region, he identifies high emissions due to coal-powered electricity. By switching to a renewable energy provider, he reduces his market-based emissions, showing tangible results in his Scope 2 profile.
Industry Applications: How Scope 2 Data Drives Sustainability
Scope 2 data is an invaluable tool across industries, enabling companies to track emissions, benchmark sustainability, and make informed decisions.
Asset Management
Asset management firms use Scope 2 emissions data for sustainability benchmarking, helping them identify companies that are leaders or laggards in energy efficiency and renewable energy usage.

For example, STOXX, a leading index provider, uses Scope 2 data to construct its Low Carbon Footprint Indices, which enable investors to align their portfolios with a low-carbon strategy.
Green Tech
Green tech companies leverage Scope 2 emissions data to help clients transition from fossil fuel-based energy sources to renewable options. By analyzing a client's Scope 2 emissions profile, these companies can recommend tailored renewable energy procurement strategies, such as power purchase agreements (PPAs) or renewable energy certificates (RECs), and track the impact on the client's emissions over time.
LevelTen Energy offers a marketplace for renewable energy Power Purchase Agreements (PPAs), supported by analytics that streamline procurement and emissions tracking. This approach allows clients to reduce their Scope 2 emissions through targeted renewable energy solutions.
Academic Research
Researchers use Scope 2 emissions data to evaluate the impact of policies and analyze financial and investment risks related to climate change.
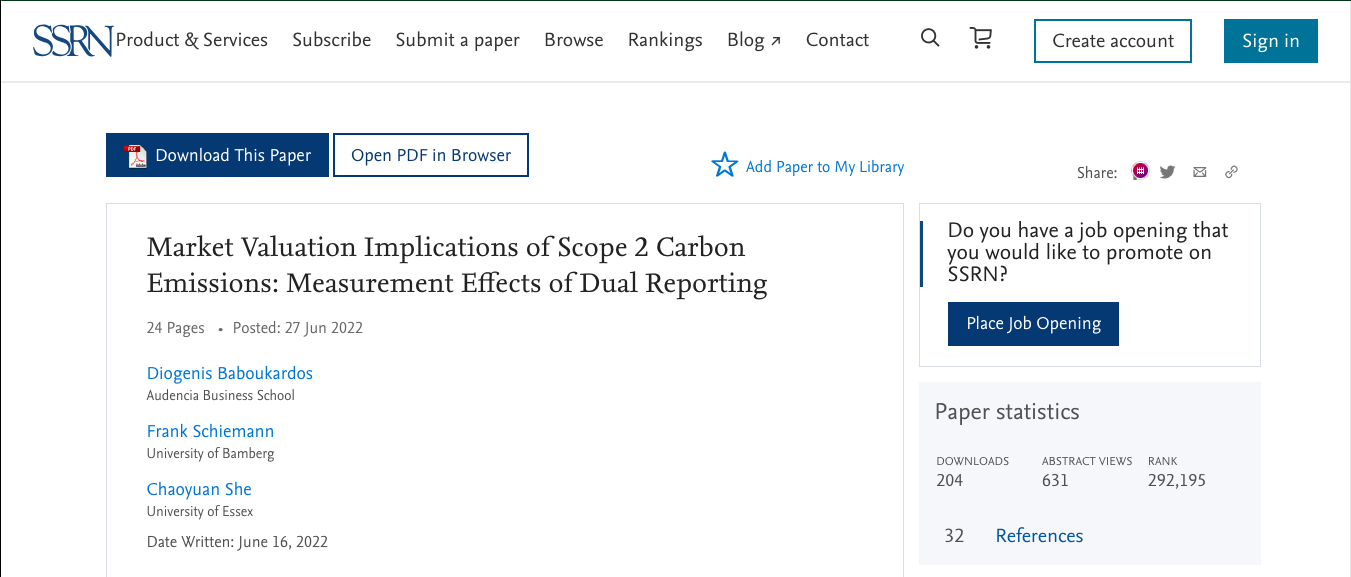
A recent study titled "Market Valuation Implications of Scope 2 Carbon Emissions: Measurement Effects of Dual Reporting" examines how Scope 2 emissions, reported using location-based and market-based methods, impact a firm's market value. The findings support dual reporting for Scope 2 emissions, highlighting its importance for standards set by the SEC, ISSB, and EFRAG.
Banking
Banks utilize Scope 2 emissions data to compute their financed emissions, which are the emissions associated with their lending and investment activities.
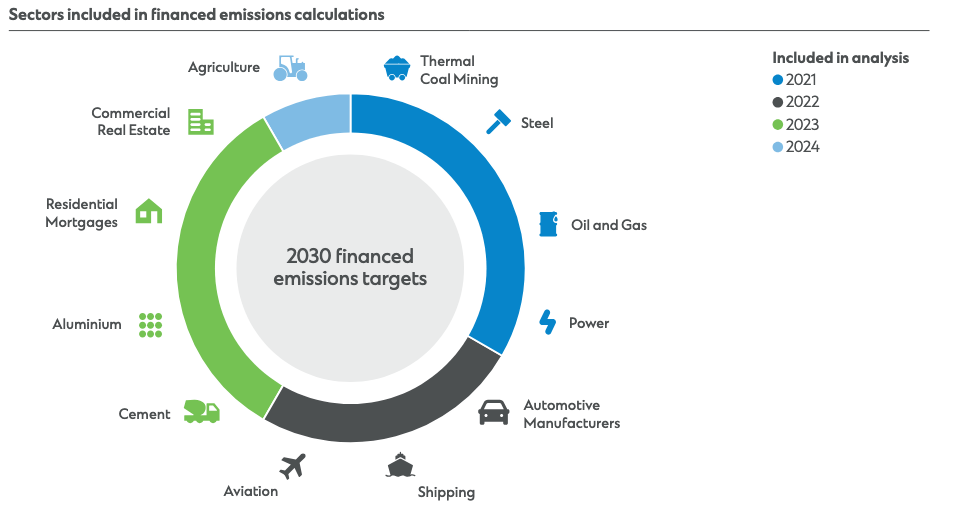
Standard Chartered, for example, uses the Partnership for Carbon Accounting Financials (PCAF) standard to quantify emissions from its financing, supporting its commitment to achieving net-zero financed emissions by 2050.
Transforming Emissions Data into Climate Action
Understanding and managing Scope 2 emissions has evolved from a regulatory requirement to a strategic imperative. Whether you're an asset manager constructing sustainable portfolios, a fin/climate tech developing innovative solutions, or a corporate sustainability leader driving organizational change, accurate emissions data forms the foundation of effective climate action. By mastering the nuances of electricity, heating, steam, and cooling emissions - and leveraging both location-based and market-based methodologies - organizations can make informed decisions that drive meaningful environmental impact while creating business value.
Ready to unlock the power of emissions data?
Explore Tracenable's GHG Emissions Data Product Factsheet to discover how our detailed Scope 2 emissions inventory covering over 5,000 global companies can drive your sustainability initiatives forward. Download a sample dataset today and join the growing community of innovators using data-driven insights to drive positive change.


