A Comprehensive Guide to Scope 1 Emission Sources and Their Practical Data Applications in ESG

Did you know that Scope 1 emissions—also known as direct emissions—account for over 30% of a company’s total carbon footprint in some industries? As global efforts intensify to reduce greenhouse gas (GHG) emissions, Scope 1 data has become essential within ESG data frameworks because they represent direct emissions—where companies have the most control and can make the most immediate impact
Scope 1 data is crucial in several areas, enabling analyses at company, industry, and sector levels, supporting regulatory compliance use cases for investment firms, and forming the basis for effective sustainability strategies aimed at emissions reduction.
In this guide, we’ll explain what Scope 1 emissions are, where they come from, and how Scope 1 data supports various ESG analysis and sustainability initiatives. This guide will provide you with practical insights for making meaningful use of Scope 1 data.
What Are Scope 1 Emissions?
According to the GHG Protocol, Scope 1 emissions are direct GHG emissions from sources owned or controlled by a company. These emissions arise from activities like fuel combustion, industrial processes, and vehicle usage—activities that contribute directly to a company’s carbon footprint.
Scope 1 data offers a direct measure of emissions from controlled sources, providing information that enables targeted analysis, company and industry comparisons, and trend tracking.
Scope 1 Emissions Sources – A Detailed Breakdown
Stationary Combustion: Energy Production at Facilities
Stationary combustion refers to emissions from fuel burned at company facilities, such as factories and warehouses. For example, a manufacturing plant using natural gas boilers generates stationary combustion emissions.

In energy-intensive industries where on-site fuel combustion is necessary for operations (e.g., utilities and power generation, manufacturing, mining, food and beverage production, paper and pulp, and so on), stationary combustion data helps to identify assets/facilities that heavily rely on fossil fuels and evaluate opportunities to shift to cleaner energy sources.
Mobile Combustion: Vehicle Emissions
Mobile combustion includes emissions from company-owned vehicles, such as delivery trucks and corporate cars. Logistics companies, for example, track fuel consumption in their fleets to calculate their Scope 1 emissions.

This is particularly relevant for sectors with extensive transportation needs, where tracking vehicle emissions informs benchmarking, fleet optimization, and reduction efforts.
Fugitive Emissions: Equipment Leaks and Releases
Fugitive emissions result from unintended leaks, such as methane from pipelines or refrigerants from industrial cooling systems. Often containing gases with high global warming potential, fugitive emissions are key to understanding high-emission sectors like oil and gas.

This data enables analysis of equipment integrity and aids in identifying sectors that can benefit from containment technology improvements.
Venting and Flaring: Controlled Gas Releases
Venting and flaring involve the controlled release of gases, often in oil and gas extraction. Venting is the direct release of gases, while flaring burns off excess gases to reduce environmental harm.

Scope 1 data on these activities provides crucial insights into how companies manage emissions in extraction-heavy industries and their effectiveness in reducing uncontrolled releases.
Process Emissions: Byproducts of Industrial Activity
Process emissions are byproducts of chemical reactions in industrial activities, such as cement or steel production. Tracking these emissions helps evaluate the impact of specific manufacturing processes and targets industries for the adoption of cleaner technology.

Practical Example: Scope 1 Emissions at a Bike Manufacturing Factory
To demonstrate how Scope 1 emissions manifest in a real-world setting, let’s look at a fictional example of a bike manufacturing factory owned by Mr. Phillip. This factory generates various Scope 1 emissions:
- Stationary Combustion: The factory’s natural gas-powered heating systems produce stationary combustion emissions data.
- Mobile Combustion: Company-owned trucks transporting bicycles to the shops contribute mobile combustion data.
- Fugitive Emissions: Small refrigerant leaks from the factory’s cooling systems result in fugitive emissions data.
- Process Emissions: Chemical treatments used in processing aluminum bike frames create process emissions data.
For stakeholders in manufacturing and similar industries, data from operations like Mr. Phillip’s factory offers a basis for benchmarking emissions, exploring reduction strategies, and identifying patterns across similar industrial activities.
Why Scope 1 Emissions Data Matters
Scope 1 emissions data is crucial across a range of industries, each leveraging it to meet regulatory requirements, support investment decisions, and design sustainability strategies.
1. Asset Management
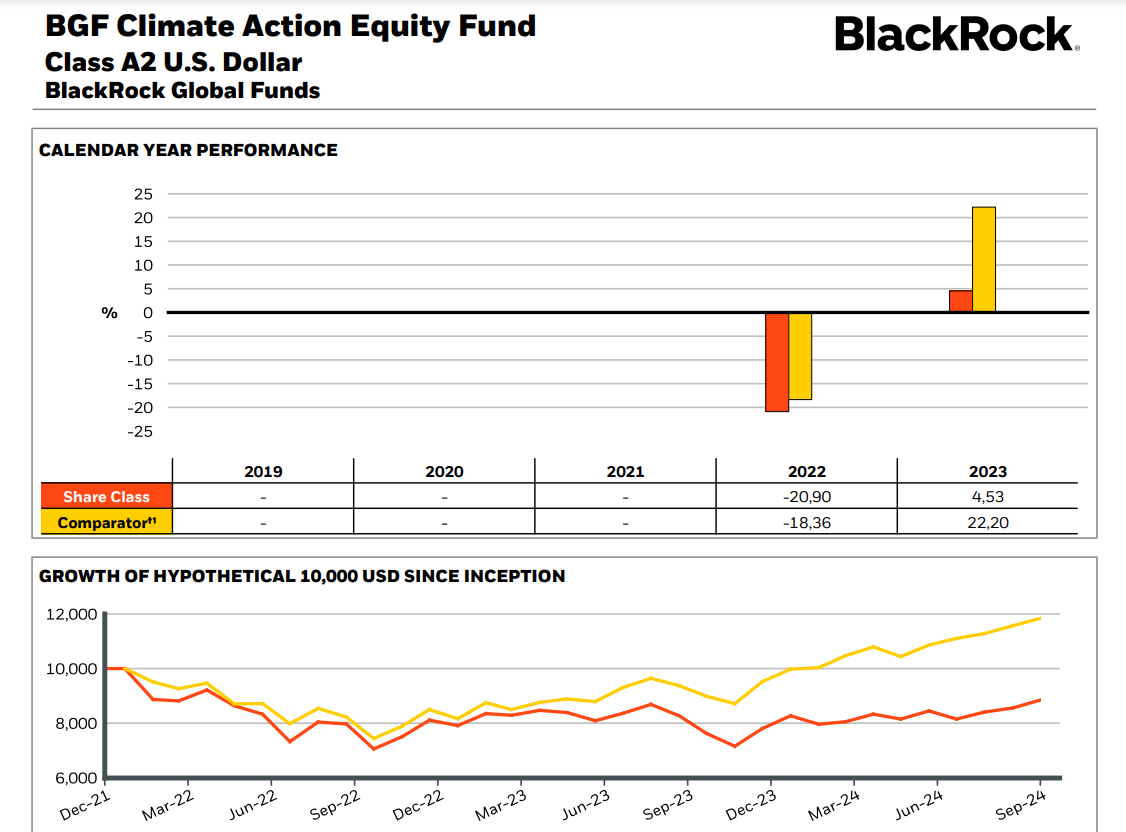
In asset management, Scope 1 data is indispensable for compliance with the EU’s Sustainable Finance Disclosure Regulation (SFDR). Under SFDR, Scope 1 emissions are a mandatory metric within the Principal Adverse Impact (PAI) indicators, and funds seeking Article 9 classification must report on this metric to align with environmental goals. By tracking Scope 1 data, asset managers can assess a company’s direct emissions, allowing them to make informed decisions on sustainable investments.
2. Banking
In the banking sector, Scope 1 data supports environmental risk assessments within loan portfolios. Banks, particularly those exposed to high-emission industries like energy or manufacturing, analyze Scope 1 emissions to evaluate the environmental impact of their lending practices. This data helps them determine risk factors tied to their clients’ carbon footprint, guiding loan structuring and terms to align with sustainability objectives.
3. Corporates
Corporates, especially those in energy-intensive sectors like manufacturing or mining, rely on Scope 1 data to monitor on-site emissions and optimize emissions reduction initiatives. Many of these companies use Scope 1 metrics not only for compliance but also to set and track their internal carbon reduction targets, demonstrating measurable progress toward sustainability.
4. Fintechs and Climate Techs
Climate tech companies are also heavy users of Scope 1 data. By incorporating it into emissions tracking tools, these companies offer solutions for corporations to capture and report emissions more efficiently. Similarly, fintech firms leverage this data to enhance ESG scoring for financial products, providing clients with reliable insights for data-informed investment and purchasing decisions.
Explore Tracenable’s Scope 1 Emissions Data
Gain insight into the emissions profiles of over 5,000 companies globally with Tracenable’s Scope 1 data inventory. Our datasets provide a comprehensive view of emissions across sectors, enabling you to benchmark industry performance, track emissions progress, and guide your sustainability decisions.
Ready to Learn More? Explore our GHG Emissions Data Product Factsheet for detailed insights into the scope, depth, and applications of our data. Access sample data and turn information into action toward a more sustainable future.


